
From 5 Seconds to 50 Milliseconds: How a Dependency Graph Fixed a Slow Frontend
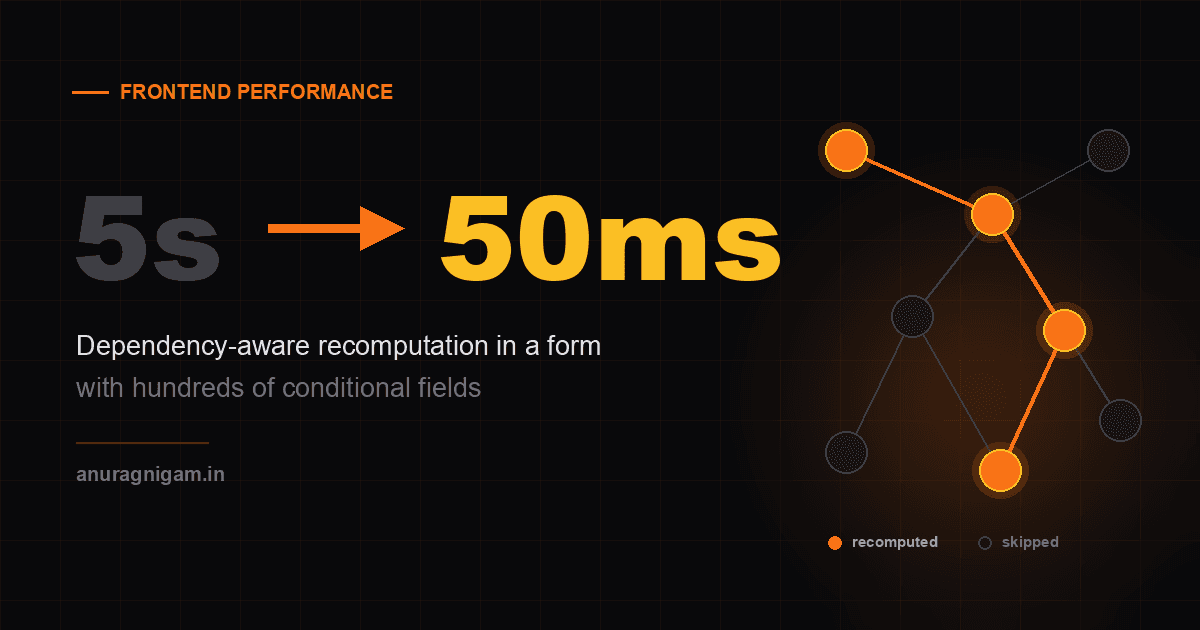
There is a running joke that frontend work is just changing button colours and adding gradients. Then you meet a form that takes five seconds to respond to a single keystroke.
This is what that bug looked like, why the first diagnosis was wrong, and what we changed.
The problem only showed up at scale
The feature was a contract creation flow built around a questionnaire. Users answer questions, and their answers decide which other questions appear. One answer can decide whether a whole section appears. That section has questions that decide whether more questions appear. With a few hundred fields, the form becomes deeply conditional.
Small templates felt fine. Twenty or thirty fields, instant response, no complaints.
The problem only appeared on the large templates our biggest workspaces actually used, the ones with hundreds of fields. There, picking a value from a dropdown or typing into an input froze the screen for several seconds. No spinner. No loading state. The window just stopped responding, then caught up all at once.
That gap matters. The bug was invisible everywhere it was cheap to test, and obvious only where it was expensive.
It looked like a slow API. It was not.
Everyone assumed network latency first, including me. A slow form usually means a slow API, and that flow had plenty of API calls.
Profiling said something else. The data had already arrived. The requests were done and the payload was in memory. The browser was not rendering because the main thread was busy running our own synchronous code.
This is the most useful thing I took from the whole exercise. Frontend debugging usually starts and stops at the network tab, because that is where the obvious numbers are. But a request that finishes in 80ms tells you nothing about the next four seconds. Main thread and long task profiling is a different view, and here it was the only one that showed the real problem.
The cause: recomputing everything, every time
Once we looked in the right place, the cause was not subtle. Every value change recomputed visibility across almost the entire questionnaire.
Change one dropdown, and the code walked every field, checked every visibility condition, and rebuilt the result. It did not matter that the field you touched only affected three others. All several hundred were recomputed, because nothing in the system knew which fields were related.
There was a second cost on top. The recompute path deep cloned the form state repeatedly to avoid mutating shared objects. Deep cloning a small object is almost free, so this never looked like a problem. Deep cloning a large nested object hundreds of times, on every keystroke, is not. It burned CPU time and added memory pressure.
Neither choice was wrong when it was written. Recompute everything is the simplest correct approach, and it works until the data grows past it. The real failure was that nothing made us revisit it when the scale changed.
What that looks like with seven questions
Real templates had hundreds of fields, which is hard to picture. Here is a simplified version with seven, just to show the shape. Two independent chains: one starts at contract value, the other at counterparty country.
The user changes contract value
Chain that depends on it
- Contract valuechanged
- Approval required?must recompute
- Approver detailsmust recompute
- Escalation contactmust recompute
Chain that does not
- Counterparty country
- Tax details
- Governing law
The two layers do different jobs, and the second one gave us most of the win.
The graph decides which fields are worth checking. That takes seven down to three. Memoization then decides whether checking them costs anything at all. If none of a field's inputs changed, the answer comes from the cache.
That second layer matters because interactions repeat a lot. A user tabbing through a section, fixing a typo, or picking the same dropdown value again asks the same visibility questions again. Once results are cached and invalidation is precise enough to trust them, the common interaction becomes a lookup instead of a computation. In most cases it became a direct cache hit.
At seven fields none of this matters and the old code is fine. That is why it survived so long. What matters is the ratio, not the count. The old cost grows with the whole form. The new cost grows only with the part you touched, and caching removes most of what is left.
Now scale that to several hundred fields, where every check also deep clones the form state, and run it on every keystroke. That is the five second freeze. Prune the set, cache the rest, and the same interaction comes back in about fifty milliseconds.
The fix: track what changed
We moved from recompute everything on every interaction to track what changed and recompute only the affected chain.
The sentence is short. The implementation was not. But each piece is familiar.
Build a dependency graph. Every visibility condition says which fields depend on which. Written out, those relationships form a directed graph: fields are nodes, and an edge points from a field to anything whose visibility depends on it. Once the graph exists, "what does this change affect" becomes a traversal instead of a guess.
Order the work. Dependencies are not flat. Field A can control field B, which controls field C. Checking C before B gives a wrong answer that has to be fixed on a later pass. Topological ordering makes sure everything a field depends on is settled before you check that field. This removes a class of bugs where the form reaches the right state but flickers through wrong ones first.
Recompute only what is affected. With the graph and the ordering in place, a change walks its dependents in a safe order and stops. Unrelated fields are never visited. On a large template that is the difference between several hundred checks and a handful.
Cache the results. Visibility results are memoized, so a field whose inputs did not change is not checked again at all.
Invalidate precisely. This decides whether the cache helps or hurts. Invalidate too much and you are back to the original problem with extra machinery. Invalidate too little and you show stale visibility, which is worse than slow, because now the form is wrong. The graph gives you the exact boundary. It tells you which cached results the change can reach.
Interaction latency dropped by about 99%. Multi-second freezes became responses fast enough to feel instant. On the large templates we profiled, a five second interaction came back in about fifty milliseconds. Completing a large contract went from around thirty minutes to five or ten. The rollout covered 50+ enterprise workspaces.
The feedback I remember best was not a number. Someone in QA said the portal felt "great now, not just good".
This is not a framework problem
It is tempting to read this as a quirk of one codebase or one framework. It is not. The shape of the bug shows up anywhere a UI computes derived state.
React has the same failure mode with different names. A useMemo with a dependency array that is too broad recomputes when nothing meaningful changed. A context value that gets a new identity on every render pushes updates into children that had no reason to care. React.memo only helps when the props it compares are stable, which is the same precision problem as cache invalidation. I wrote about a related version of this in how React's diffing algorithm uses keys, where an unstable key makes the reconciler redo work it could have skipped.
The framework decides how rendering is scheduled. It does not decide whether your own computation knows what changed. That part stays your responsibility no matter what you build in.
Frameworks built on signals make this explicit, because dependency tracking is the model rather than something you bolt on afterwards. If you are not using one and your derived state gets complicated enough, you tend to end up building a small version of it yourself. That is effectively what we did.
The argument about cloning mattered more
Fixing the slow code was satisfying. What happened next mattered more.
The deep cloning we found was not specific to this feature. It was a habit across the codebase, because deep cloning feels safe. So it turned into a wider discussion about how we copy and transform data, and we compared the options properly:
- Shallow copy is nearly free, but it only protects the top level. Nested objects stay shared. Fine when you know the shape, risky when you do not.
JSON.parse(JSON.stringify(value))is the reflex answer. It is also the most expensive common option, and it quietly loses data.undefined,Date,Map,Set, functions and circular references either disappear or throw.- Lodash
cloneDeephandles far more types correctly and is a fine default outside hot paths. Handling every type has a cost you pay on every call. - Internal deep clone helpers can be faster because they assume things about our own data. That assumption is what makes them break when the shapes change.
- Native
structuredClonehandles most structured data correctly, ships with the browser instead of your bundle, and is a good default in modern environments. It still does not clone functions, and it is still not free.
We did not conclude "use X". We concluded that copying is a tradeoff, not a default utility choice. The right answer depends on four things: what correctness you need, what shape the data is, what it costs, and whether the code runs in a hot path. A clone that is fine in a submit handler can be a bad idea inside a keystroke handler.
What I took from it
- Deep cloning in hot paths gets expensive at scale, and the cost stays invisible until the data is big.
- Full recomputation is simpler to write. Dependency aware recomputation is what scales.
- Caching only helps when invalidation is precise. Imprecise invalidation gives you the old speed with new complexity, or correctness bugs.
- Frontend debugging needs main thread and long task analysis. API timings will point you at the wrong thing with confidence.
- Profile at production scale. Small workflows hide the bottlenecks that matter, and the cheapest environments to test in are the least likely to show them.
The wider point is that frontend performance is not only about faster APIs, smaller bundles, or fewer renders. Sometimes the data has already arrived and the bottleneck is synchronous work happening after it. That failure does not show up on the usual dashboards.
And the fix that lasts is not the one that swaps a slow function for a fast one. It is the one that leaves behind better debugging habits, a real discussion about tradeoffs, and enough context that the next person does not have to work it all out again.
Graphs, topological ordering and memoization are not just interview topics. They are what a form needs once it gets big enough.
This article expands on two posts I wrote while the work was fresh: on using graphs and caching in the UI and on debugging the freeze itself.

Anurag Nigam
Software Development Engineer II at SpotDraft with 4+ years of experience. I write about software engineering, AI systems, markets, and things I build.
About Anurag Nigam →